As anyone who owns a fitness tracker will attest, data can be incredibly useful in training. It can also be highly addictive and a lot of fun to read and see what it reveals about us. Data can often paint a picture and in regards to our fitness, which can show us just how we stack up against the competition and how you’re improving.
I really like the idea of creating an ‘athletic profile’ and with that in mind, I thought I’d look at some of the different metrics and data points you might use to that end – some of which can provide highly nuanced information that you can use to predict your performance and to improve your ‘fitness tracking’ efforts.
Specifically, you’ll be able to calculate how much of your genetic potential for adding muscle mass you’ve achieved, what your top speed over distance is and how many calories you burn at any given time. By the end, you’ll be able to create a sheet of numbers that will tell any coach or trainer pretty much everything they need to know about your current fitness level.

Let us begin…
Demographics
The most basic place to start is with your basic demographics. That means:
SUPERFUNCTIONAL 3: SUPERMOVER - SPRING SALE!
Supermover is a program that builds an athletic physique and functional performance with short, accessible, & fun home workouts.
GET SUPERMOVER HERE!
- Age
- Height
- Weight
- Gender
- Race
These are important because they will help you to objectively compare the statistics we reveal later to others. What is considered ‘fit’ for an 80-year-old is very different from someone in their 20s! That and this information will be necessary in order to calculate some of the other points in this list.
Body Fat Percentage
The next best place to start is with your body fat percentage. This will provide you with an indicator of how much of your body mass is made up of fat, which in turn can help you to work out how lean you are and how muscular.
There are a number of different ways to get this number but a popular strategy is as follows:
- Hang your arm out at one side
- Get a friend to take a ruler and find the halfway point between the shoulder and elbow, on the side of the tricep
- Get them to pinch a fold of skin and fat away from the muscle and then measure the thickness of that skin. The following table can then be used to assess your rough body fat percentage:
| Skin fold thickness in mm | Bodyfat % Men | Bodyfat % women |
| 6 | 5-9 | 8-13 |
| 13 | 9-13 | 13-18 |
| 19 | 13-18 | 18-23 |
| 25 | 18-22 | 23-28 |
| 38 | 22-27 | 28-33 |

Lean Body Mass
Now you have your body fat percentage index, you can start to work out your lean body mass index. This is a much more interesting and useful metric than BMI, because it lets you differentiate between fat and muscle.
To calculate lean body mass, you simply need to take your current body mass and then subtract the percentage of body fat. So if you weighed 176.4lbs and your body fat percentage was around 10%, then you would have a lean body mass of 158.76. That’s me, BTW.
Bodybuilders looking to bulk up should focus on their LBM and not just their weight, as that way they can differentiate between fat and muscle mass. Unfortunately, there’s no way to work out how much of you is bone and organs, so we can’t extract the ‘pure’ muscle mass from that number.
Fat Free Mass Index
We can take this further too and use this information to calculate a ‘Fat Free Mass Index’. This is based on the BMI (which as we just mentioned, it pretty much a useless measure) but again accounts for muscle mass and this time height.
To calculate your FFMI, simply use the following equation:
FFMI = (LBM in kg) / (height in meters)2.
That is your lean mass in kg, divided by your height squared in meters. 158.76 in Kg is 72.012 and my height squared in meters is 3.122. That means I have FFMI of 23.065.
This is a particularly interesting number because it lets us roughly calculate our raw genetic potential. One study (1) found that 25 is pretty much the upper limit for guys who don’t use steroids. 19 is average.
Remember, to work out what percentage A is of B, you simply divide A by B and then multiply by 100. To see what percentage of your potential you have fulfilled, just take your FFMI, divide by 25 and multiply by 100.
So that means I have personally obtained 92.26% of my genetic potential, unless I were to use steroids. The average guy has achieved 76.00% of their FFMI. That means I have fulfilled (approximately) 17.91% more of my potential than average. That’s pretty cool.

Bruce Lee meanwhile is said to have had a bodyfat percentage of about 2.4% and he weighed approximately 135lbs at 5’7’’ for most of his life. At his heaviest though, he was apparently at 165lbs. This would have given him a lean body mass of about 161 and an FFMI of 25.20. That’s right, if these stats are correct it means he reached his genetic potential!
Active Metabolic Rate
Now we have our LBM, we can also more accurately workout our AMR or ‘Active Metabolic Rate’. This is how many calories you burn in a day. There are several equations for this but the best ones are those that are based on your LBM – seeing as muscle is metabolically active (in other words, muscle burns calories).
Before we do this, we must calculate BMR. This is ‘Basal Metabolic Rate’ – the number of calories you burn simply to stay alive. In other words, if you didn’t move one inch all day, you would still burn this number just to power things like blinking, breathing and digesting.
Your BMR can be calculated as such:
BMR = 370 + (9.79759519 x LBM(lbs))
Or
BMR = 370 + (21.6 x LBM(kg))
162.288 gives me a BMR of 1,960. So in 24 hours, with zero movement, I would burn 1,555.466kcal.
To get the AMR, which includes all of your regular activity, you then simply refer to the numbers below and multiply by your score:
- 1.2 if you’re sedentary (little or no exercise)
- 1.375 if you’re lightly active (you exercise 1-3 times a week)
- 1.55 if you’re moderately active (you exercise or work about average)
- 1.725 if you’re very active (you train hard for 6-7 days a week)
- 1.9 if you’re highly active (you’re a physical labourer or a professional athlete)
This isn’t an exact science, so if you find you’re somewhere between two points, you can guestimate your score. I’m probably around 1.6 seeing as I train hard 5 days a week – more than average but not quite 6-7 days. And I’m fairly inactive while working.

So my AMR is 2,488. That’s how many calories I burn daily. And if I eat under that amount in a day, I will maintain a calorie deficit, thereby ensuring that I can lose weight. I need to eat more than that amount if I want to build muscle or add mass. I alternate between both strategies so that I add mass some days and chisel away fat on others.
Out of interest, I calculated what my AMR used to be when I was the same weight at 8% body fat. That put it well over 3,100kcal, which goes to show just what a massive difference muscle mass can make to weight loss!
Heartrate
Another interesting metric to retrieve is your maximum heartrate (MHR) and resting heartrate (RHR). Maximum heartrate is how fast your heart can pump when it’s really working, while RHR is how slowly it pumps when you’re just chilling.
To find your MHR, all you need to do is to train at maximum intensity for a few minutes and see how high you can get your heartrate to go. You can measure this with a fitness tracker, or with a finger to take your own pulse.
Mine is something like 192.
Your resting heartrate meanwhile is how low your heartrate drops when you’re completely at rest. This number is a good indicator of your heart health and specifically of the size of your left ventricle. This gets bigger as you train and the larger it becomes, the more blood you can pump around your body with the fewest beats. This tells you roughly your ‘stroke volume’ – the volume of blood you can move with each pump.
Taking your RHR is a little tricky because your heartrate will fluctuate a lot throughout the day. Right now my heart rate is 72 which is pretty high – but that’s because I’ve just had two strong Americanos and I’m working hard.
The best time to get your resting heartrate then is first thing in the morning when you have just woken up. Mine this morning was 63bpm, though it dropped down to 49bpm when I was in deep sleep.
VO2 Max
With these numbers we can now workout our VO2 max. This is the amount of oxygen (in litres) that you are able to use per minute and it’s once again a good measure of overall fitness – one that correlates closely with athletic performance. The better your VO2 max, the further and faster you will be able to run.
To get a very rough estimate of your VO2 max, use the following equation:
VO2max = 15.3 x (MHR/RHR)
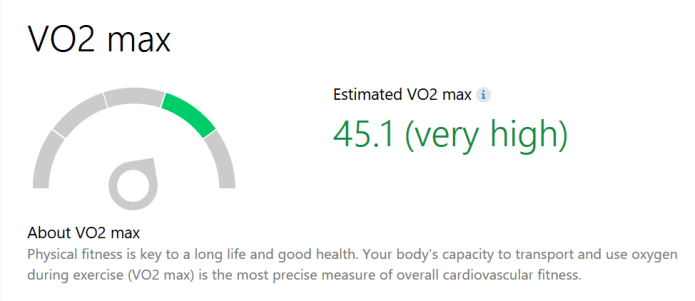
This gives me a VO2max of 46.62. This is slightly higher than the estimate that Microsoft Health gives me (based on data from the Microsoft Band 2) at 45.1.
According to Microsoft, low is anything below 26, moderate is 26-31, high is 32-35, very high is 36-46 and elite is above 46. I really don’t think my VO2max is that high, so Microsoft is probably closer than my calculations here. I’ll average the two to give myself 45.86.
Lactate Threshold
Another indicator of performance is your lactate threshold or ‘lactate inflection point’. This is the point at which lactate builds up in the blood faster than it can be used. Lactate used to be blamed for muscle fatigue and thought of as a ‘bad thing’ but actually it turns out that it is a useful form of energy that the muscles can use. For a highly trained athlete, the body will actually prefer using lactate versus glucose.
Lactate is a by-product of glycolysis however and also correlates with the increase in other metabolites associated with the energy systems – metabolites that do lead to muscle fatigue. What’s more, is that the brain responds to a sudden increase in lactate in the blood by making us feel nauseous, forcing us to reduce the energy demands we’re placing on our bodies before we pass out.
In short, although lactate is good, the point at which lactate begins to accumulate in the blood above resting levels is normally the point at which the body is close to fatiguing. This is normally the point at which the body switches from the aerobic energy system (jogging) to anaerobic energy system (sprinting). Lactate is as energy in the body via a process called the ‘Cori cycle’ but this is too slow to be used during intensive exercise. The good news is that athlete can train their Cori cycle and improve their lactate threshold. Elite athletes have a lactate threshold of around 70-80% of the VO2 max and this tends to correlate with their anaerobic threshold. For untrained individuals, it is around 50-60% VO2 max.
The best way to find your rough anaerobic threshold and thereby your rough lactate threshold is to try the ’30 minute test’. Most people should be able to maintain roughly their AT for about 30 minutes. This means that if you run all out for 30 minutes and then take your average heartrate, you should be able to work out roughly what your AT is. Over 20 minutes my best pace is around 7’27’’. So it takes me 21 seconds 81 to complete a three mile run at full pelt. During that, my heartrate was at 180. We can’t use this to work out my anaerobic threshold however as I didn’t go for the full 30 minutes and I likely would have had to slow down.
Running Speed
A similar term is ‘OBLA’ or ‘Onset of Blood Lactate Accumulation’. The terms are used largely synonymously, although they are subtly different. The best use of working out this number is that it tells you the top speed you can maintainbefore you reach lactate threshold (just below OBLA). This is the speed that you can maintain indefinitely.
My speed is pants when you compare it to the best ever 5k time (3.1 miles) which is 12.37 minutes – a pace of 4’123’’! The average pace for a guy my age during a 5k is 9’54’’ though, so I’m not too bad… (they likely aren’t running at their lactic threshold though).
If you do find your lactate threshold, you can also use this to work out your RSLT – your ‘Running Speed at Lactate Threshold’. That is how fast you can run for 30 minutes, in which case you will simply divide the distance you covered in meters by the number of seconds it took you to cover them.
Calculating all this information might seem like a lot of work but what you’ll be left with is a very good idea of your performance capabilities, how you stack up and where you can improve. I’m going alright in terms of muscle mass but I have a bit of work to do to improve my running speed and cardio fitness. Usain Bolt is able to run at 28mph when he completes the 100 meters but some new research suggests that the absolute limit to human speed might be a crazy 40mph. The limiting factor, it turns out, is the speed at which the muscle fibres can contract (2). This allows the runner to exert more force on the ground in a shorter amount of time, thereby propelling yourself faster.
These are just some of the metrics you can use to measure your performance. Take a look at your own and see how you measure up!